LeetCode 2280 - Minimum Lines to Represent a Line Chart
Difficulty: medium
Problem Description
English (Minimum Lines to Represent a Line Chart)
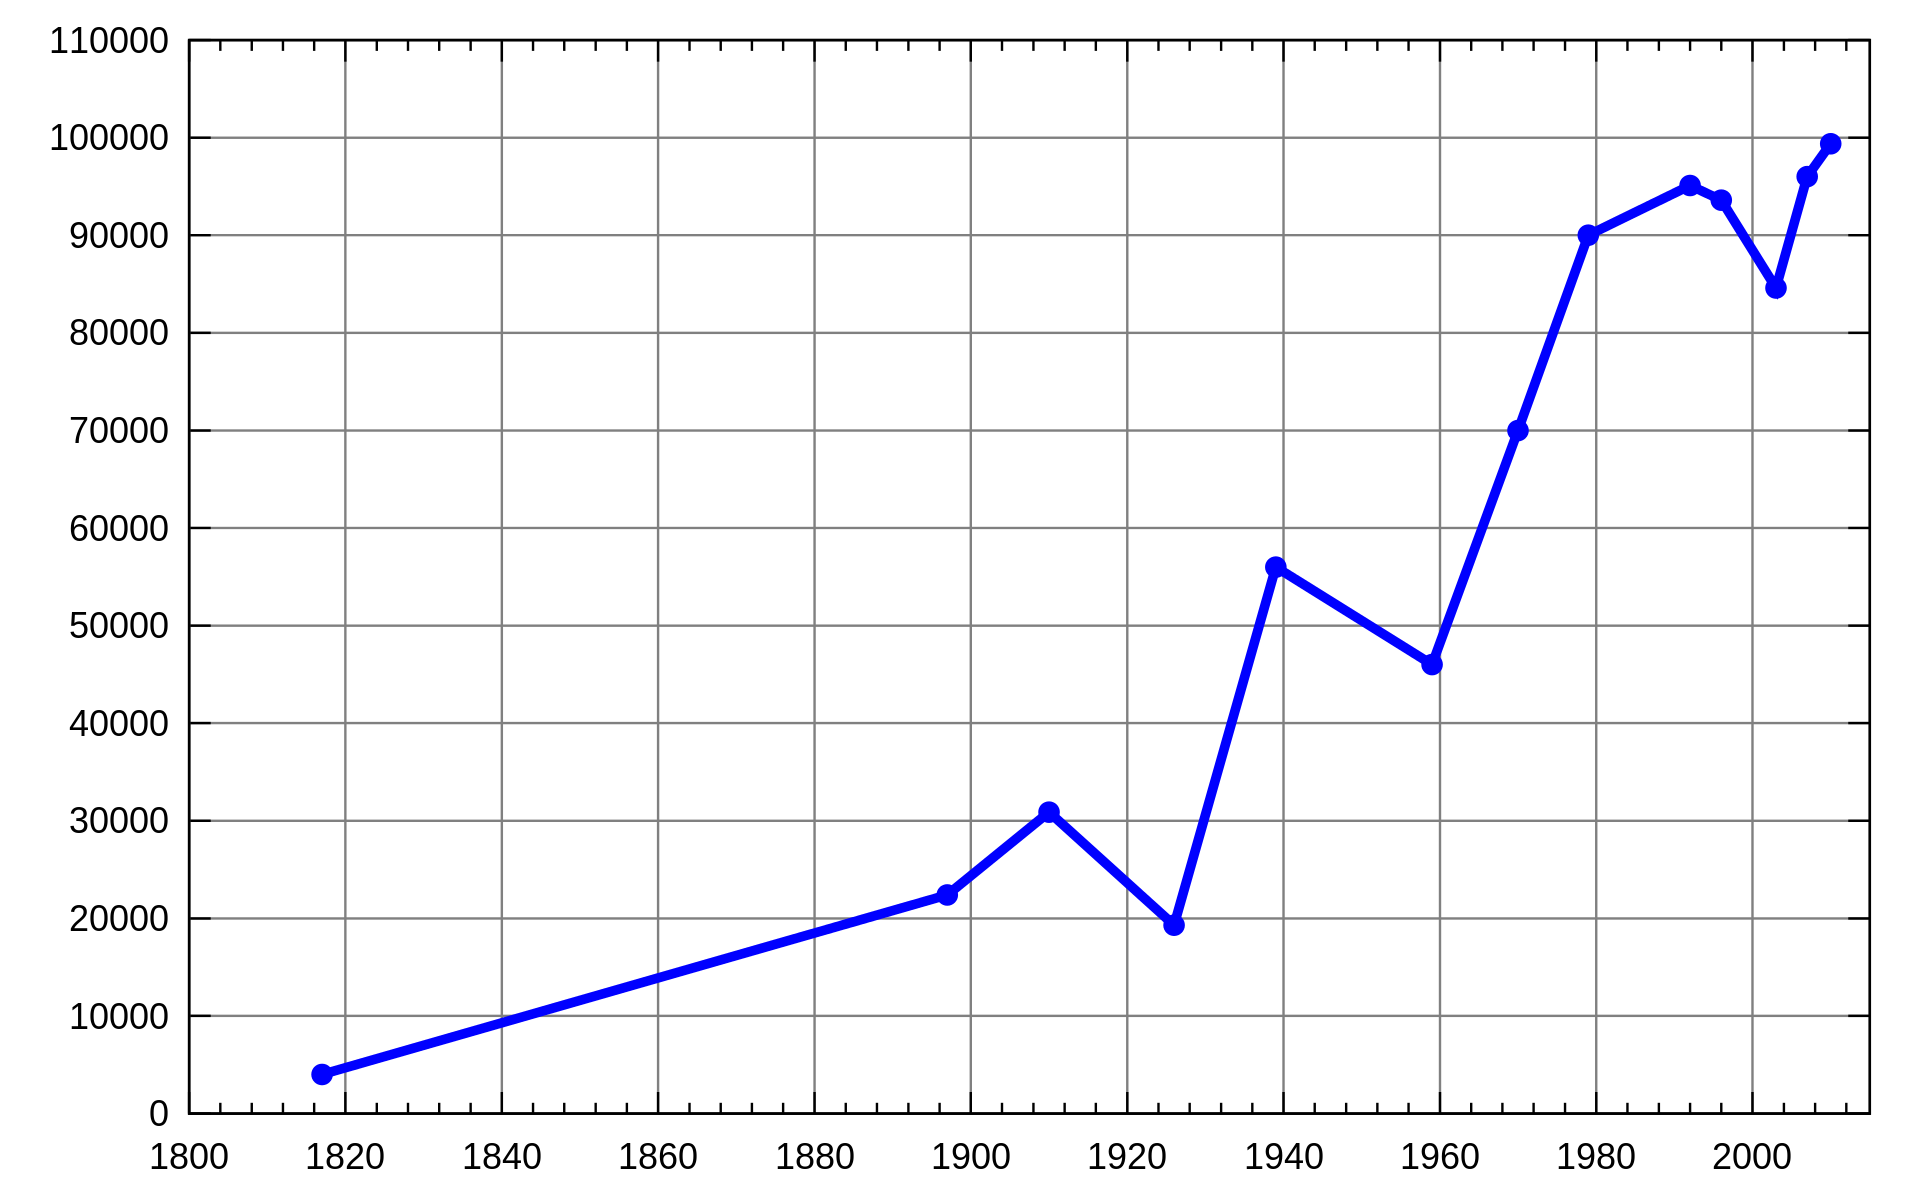
You are given a 2D integer array stockPrices where stockPrices[i] = [dayi, pricei] indicates the price of the stock on day $day_i$ is $price_i$. A line chart is created from the array by plotting the points on an XY plane with the X-axis representing the day and the Y-axis representing the price and connecting adjacent points. One such example is shown below:
Return the minimum number of lines needed to represent the line chart.
Example 1:
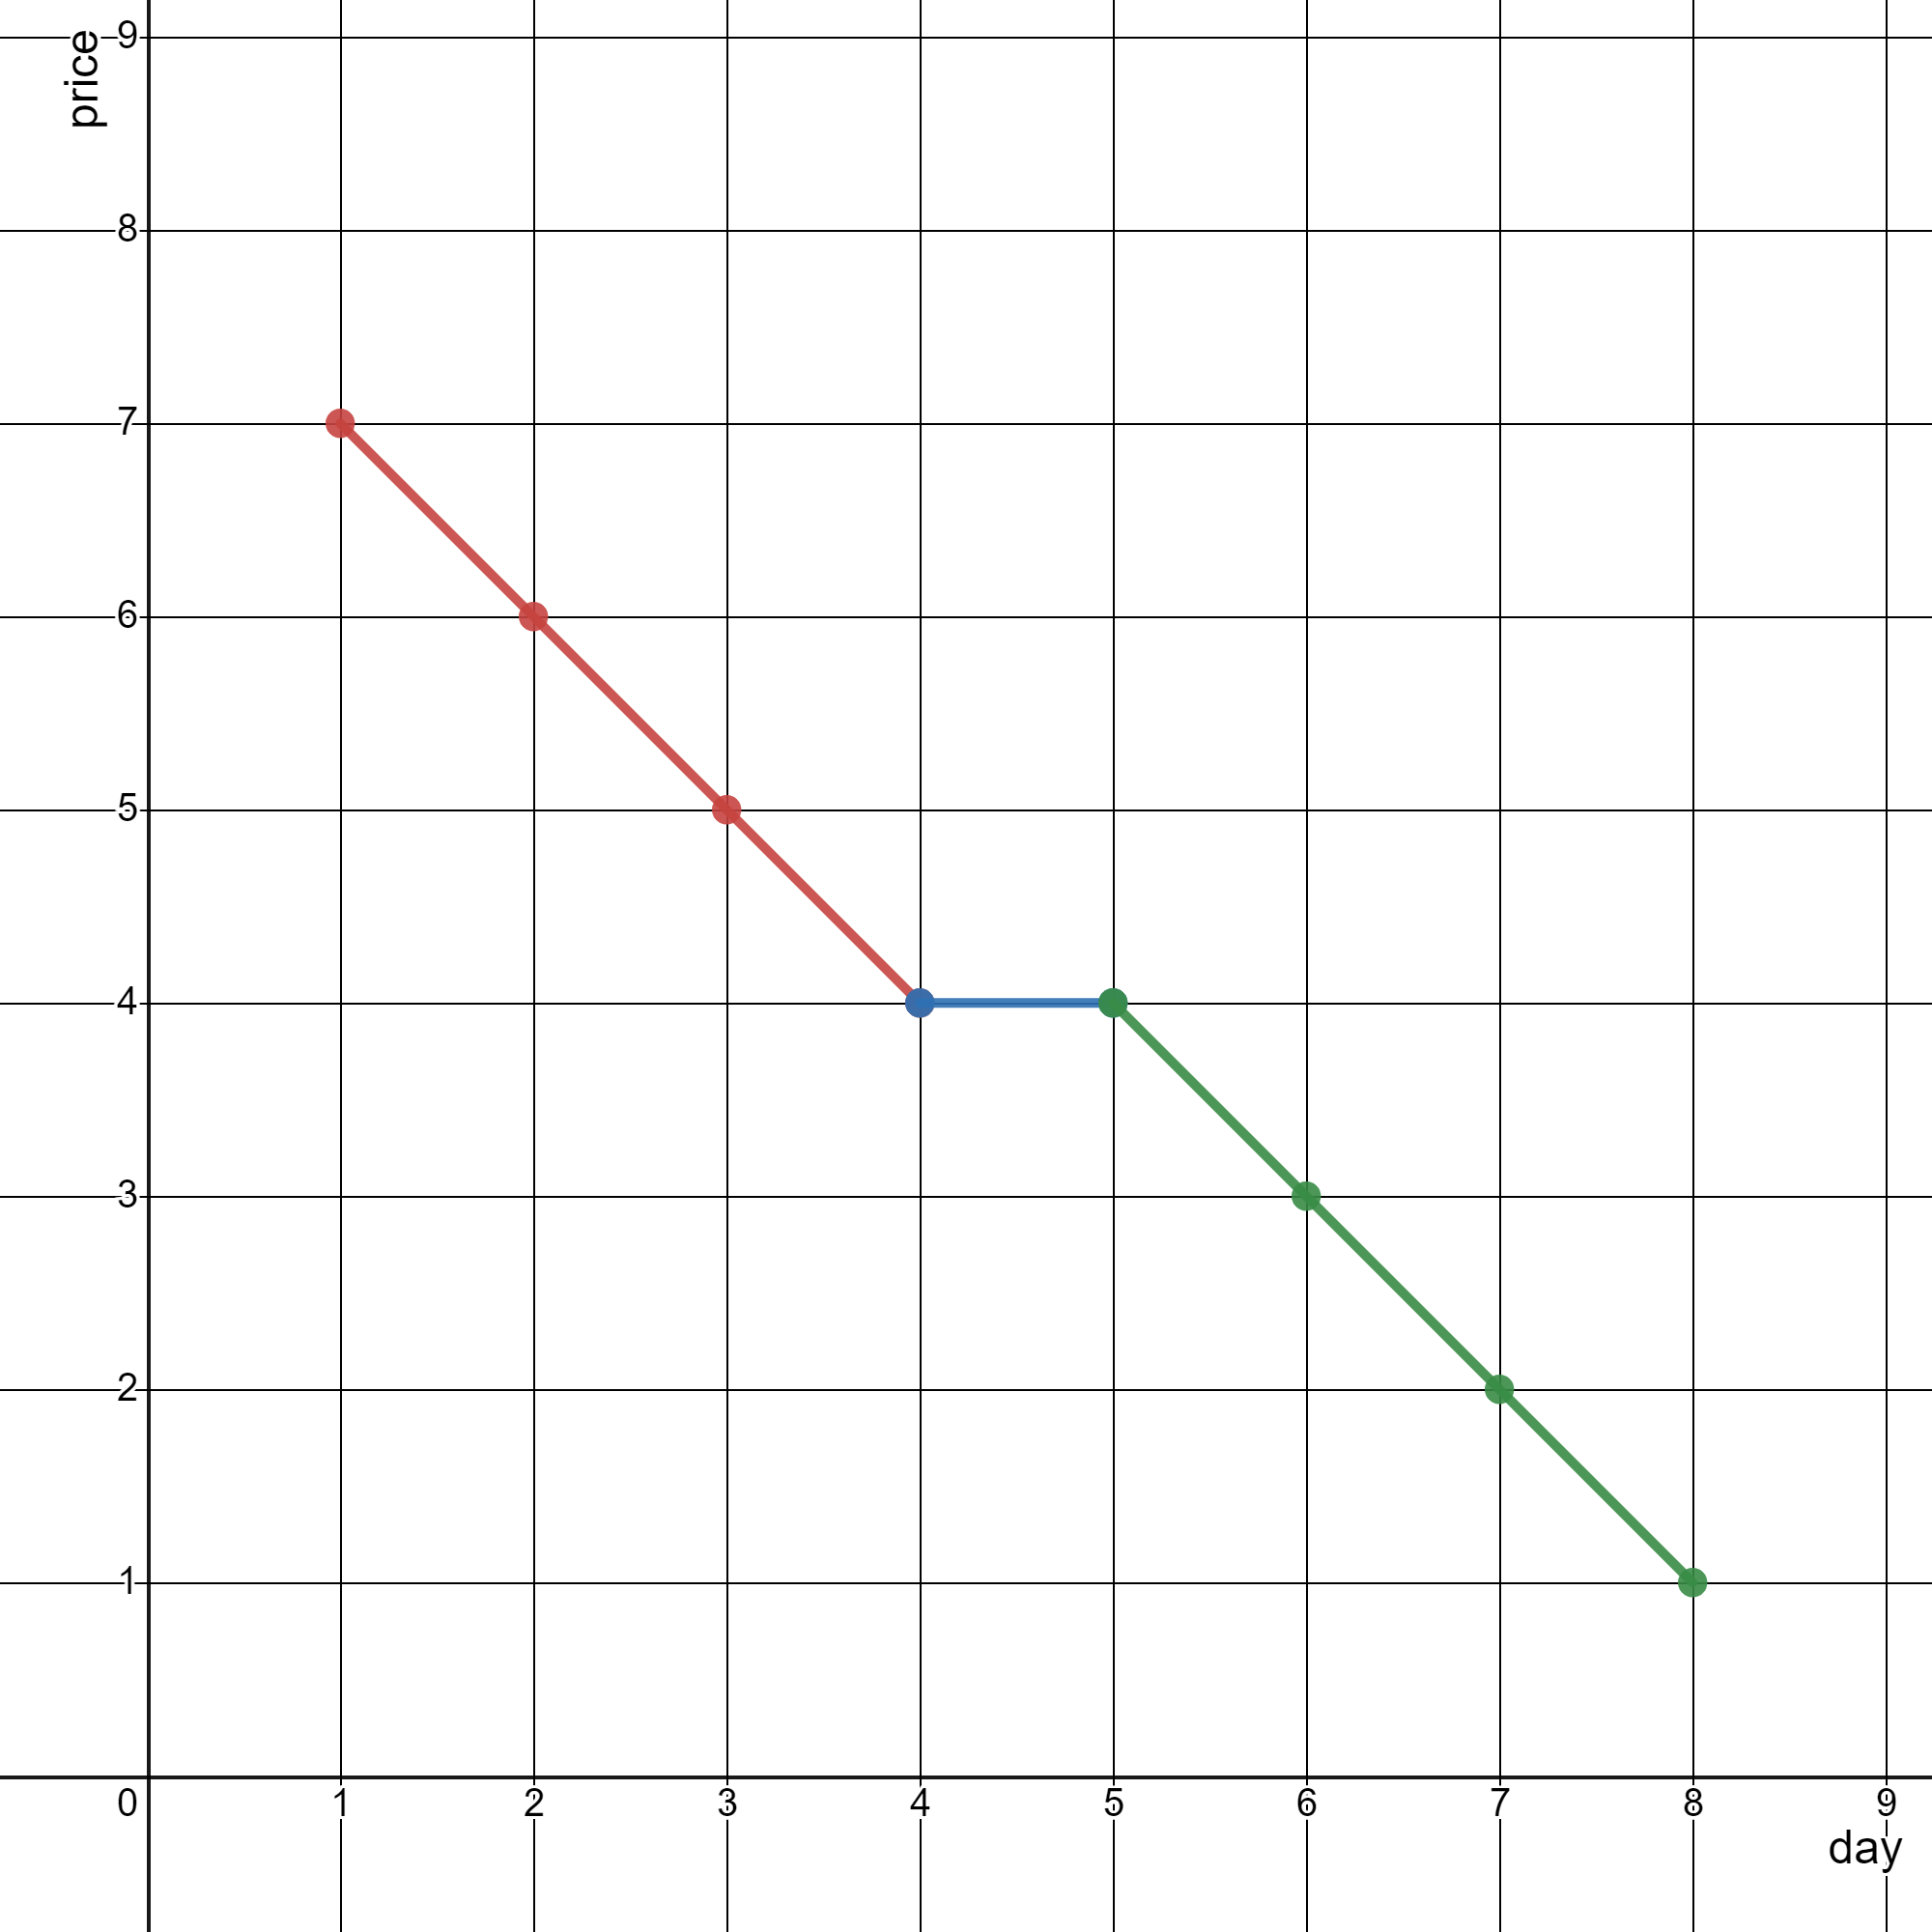
1 | |
Example 2:
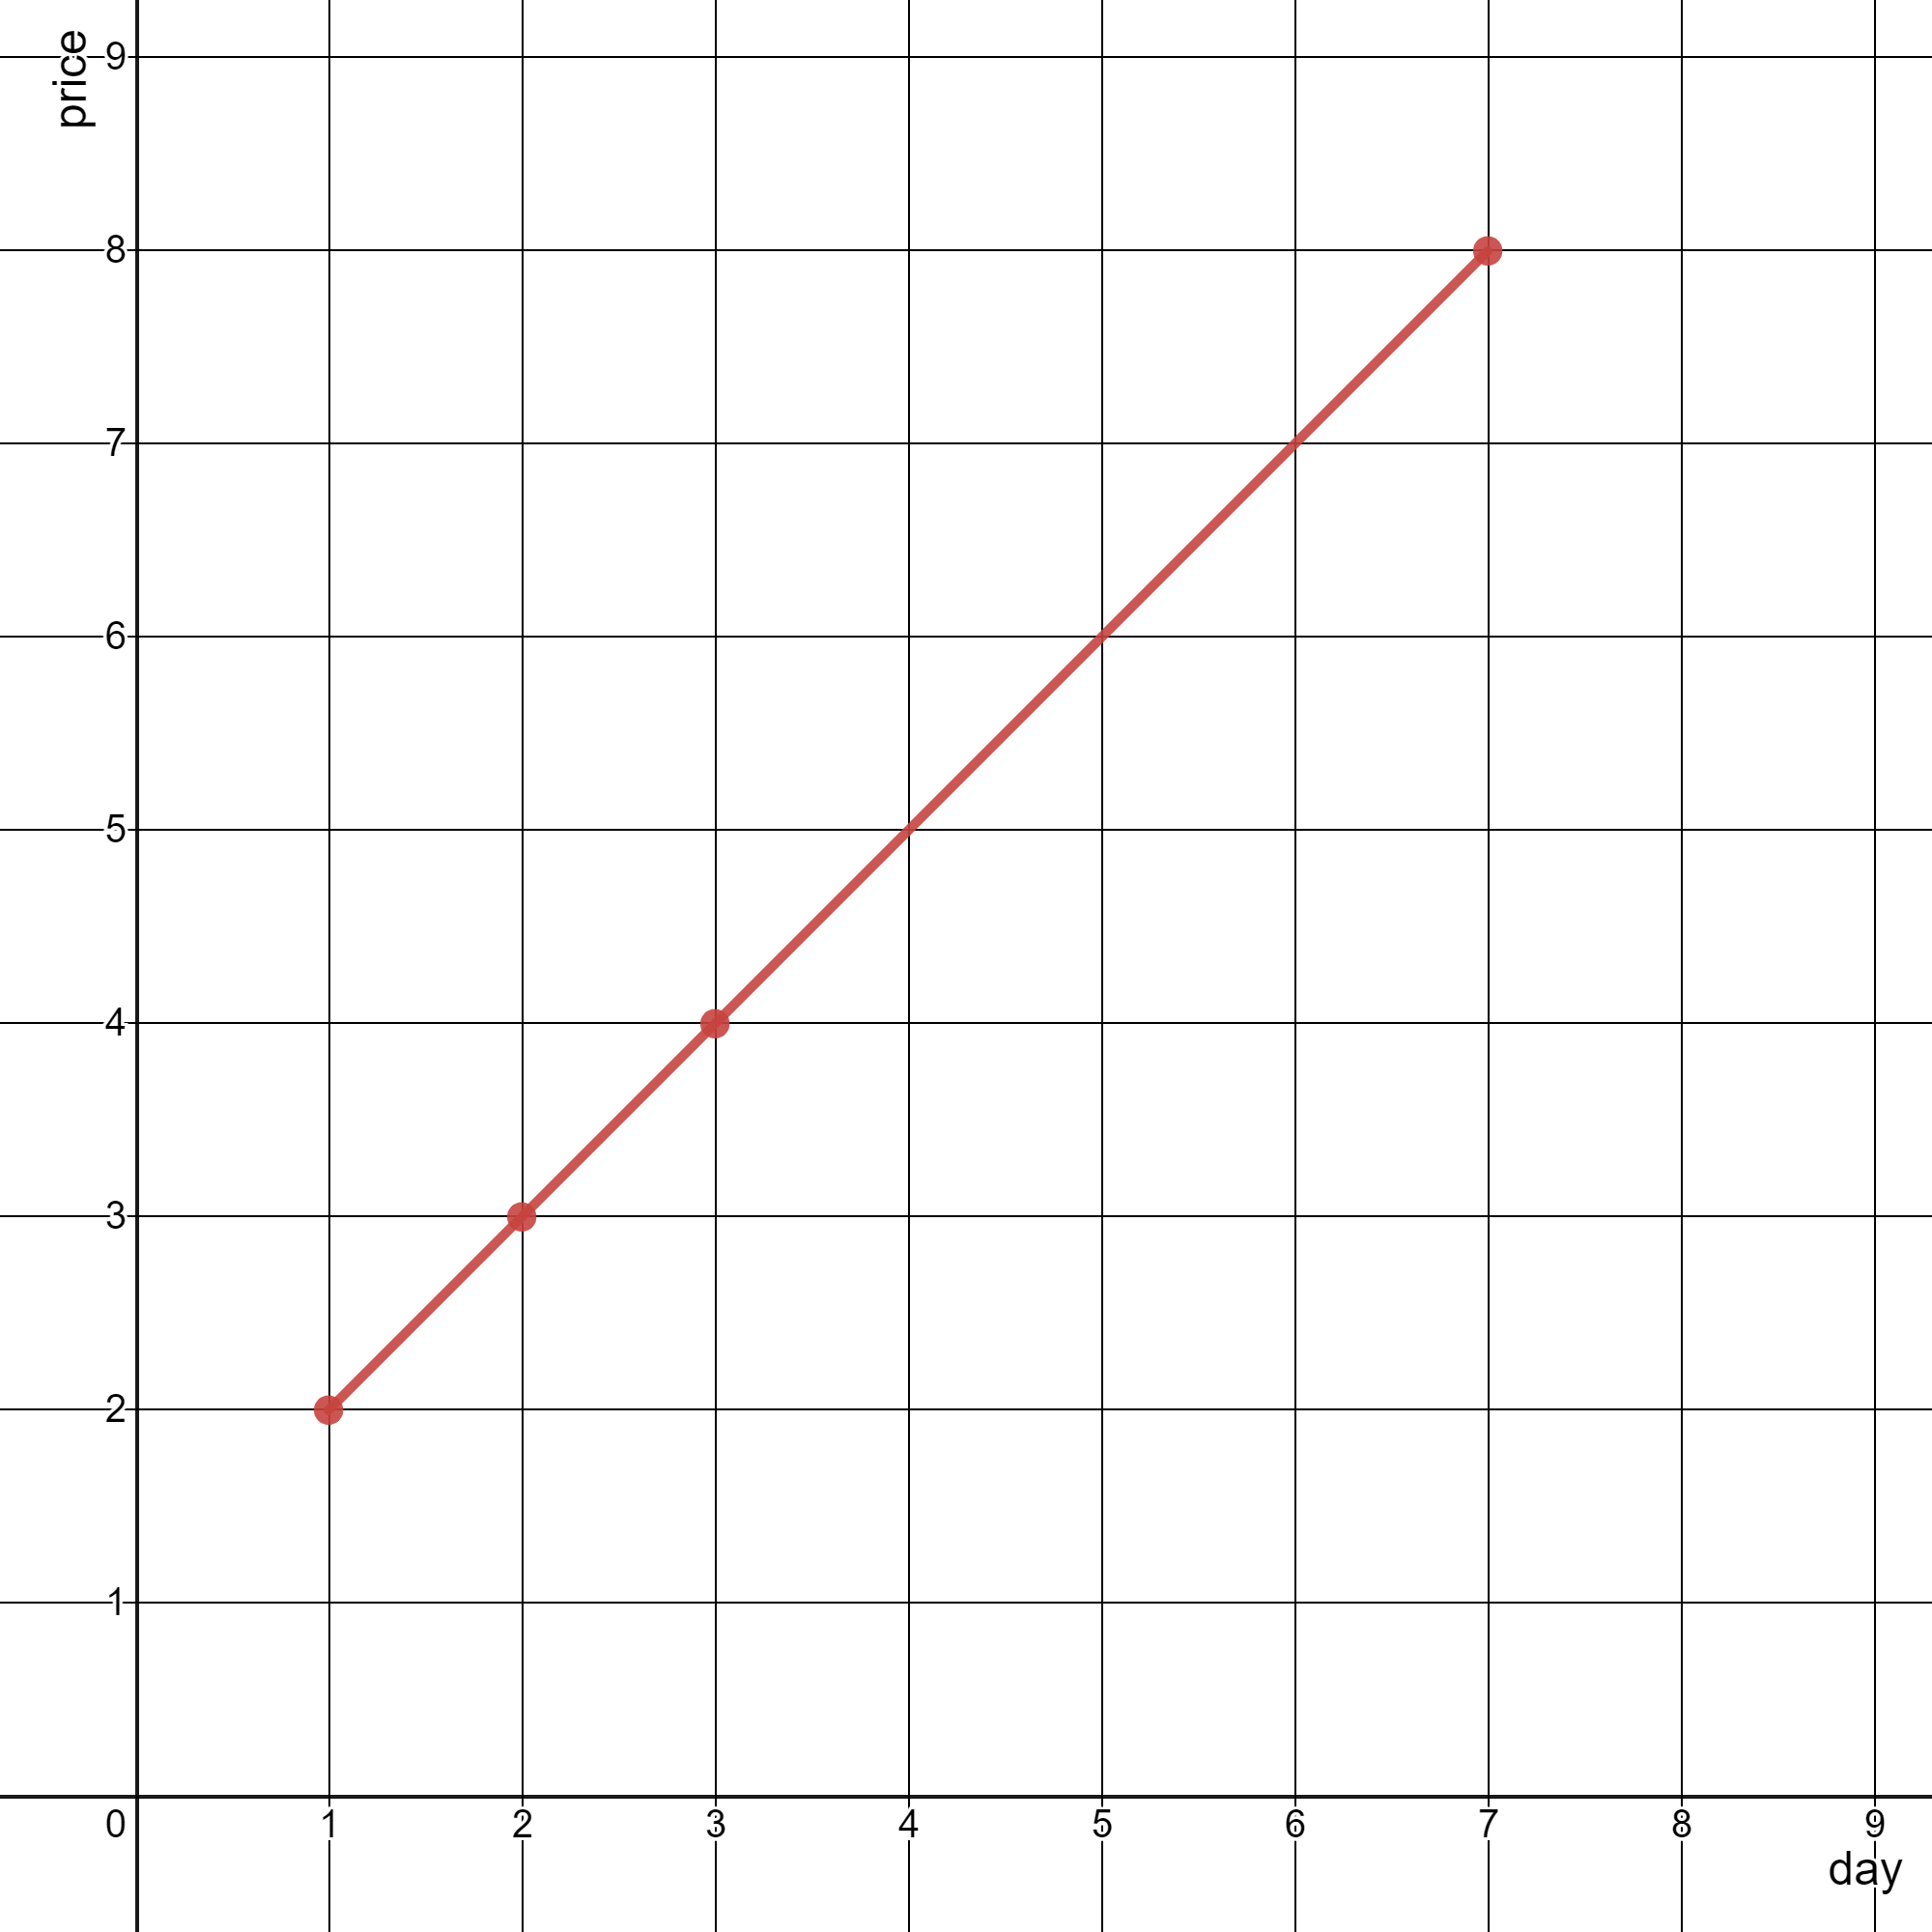
1 | |
Constraints:
1 <= stockPrices.length <= 10^5stockPrices[i].length == 21 <= dayi, pricei <= 10^9- All $day_i$ are distinct.
Chinese (表示一个折线图的最少线段数)
给你一个二维整数数组 stockPrices ,其中 stockPrices[i] = [dayi, pricei] 表示股票在 $day_i$ 的价格为 $price_i$ 。折线图 是一个二维平面上的若干个点组成的图,横坐标表示日期,纵坐标表示价格,折线图由相邻的点连接而成。比方说下图是一个例子:
请你返回要表示一个折线图所需要的 最少线段数 。
示例 1:
1 | |
示例 2:
1 | |
提示:
1 <= stockPrices.length <= 10^5stockPrices[i].length == 21 <= dayi, pricei <= 10^9- 所有 $day_i$ 互不相同 。
Solution
C++
1 | |
LeetCode 2280 - Minimum Lines to Represent a Line Chart
http://wasprime.github.io/Algorithm/LeetCode/LeetCode-2280-Minimum-Lines-to-Represent-a-Line-Chart/